
IPEDS Data Center, Graduation Rate Data, Total Students, Gender, Race & Ethnicity, 2012. The graduation rates are based on the student's completion status as of August 31, 2012. 2013 graduation rate data has not been released by IPEDS.
Total Student Enrolled Data comes from IPEDS Data Center, Fall Enrollment, Race/Ethnicity, Fall 2006 and Fall 2009
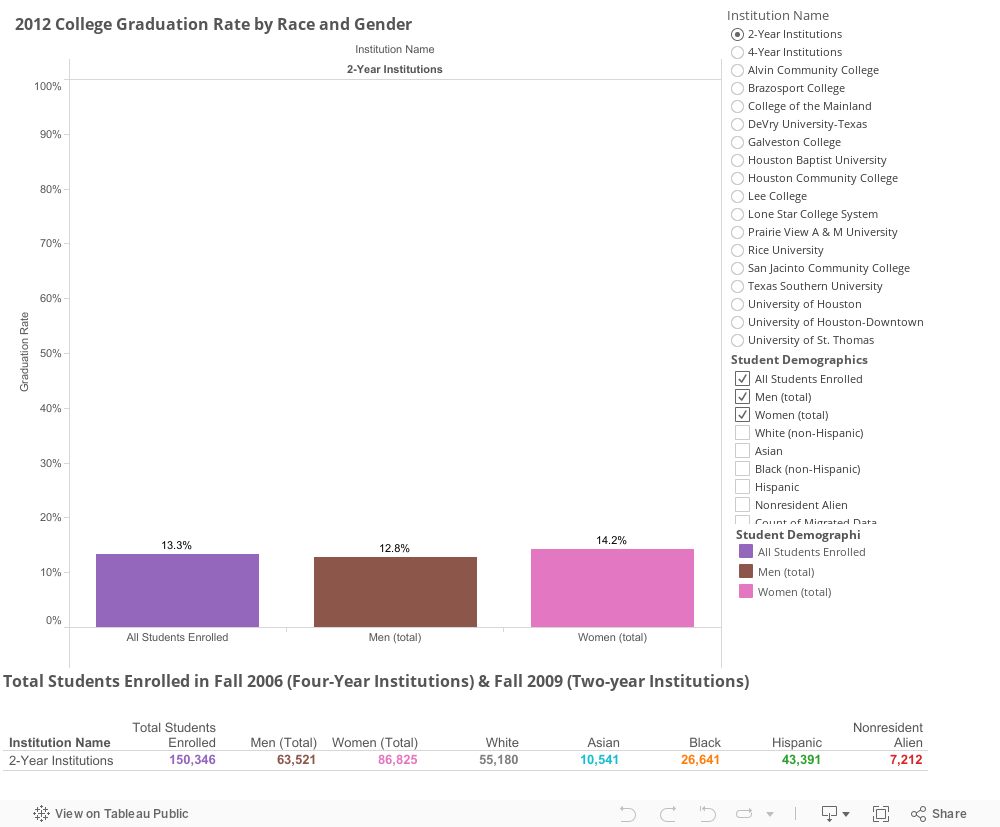
*Graduation rates of full-time, first-time, degree/certificate-seeking undergraduates within 150% of normal time to program completion, by gender and race/ethnicity: 2006 cohort for four-year institutions, 2009 cohort for two-year institutions. The percent total is the percent of all students from that gender and/or race/ethnicity that graduation within 150% of time.
Total Student Enrolled Data comes from IPEDS Data Center, Fall Enrollment, Race/Ethnicity, Fall 2006 and Fall 2009
*Graduation rates of full-time, first-time, degree/certificate-seeking undergraduates within 150% of normal time to program completion, by gender and race/ethnicity: 2006 cohort for four-year institutions, 2009 cohort for two-year institutions. The percent total is the percent of all students from that gender and/or race/ethnicity that graduation within 150% of time.
The Percent of Total Undergraduate Enrollment by Race and Gender
*Fall 2012 enrollment data is provided to be used in comparison to the visualization above. Graduation rates are shown at 150%. Graduation rates for the data below will be available in summers 2015 and 2018 respectively.
*Fall 2012 enrollment data is provided to be used in comparison to the visualization above. Graduation rates are shown at 150%. Graduation rates for the data below will be available in summers 2015 and 2018 respectively.

IPEDS Data Center, Fall Enrollment Data, Total Enrollment by Race/Ethnicity (new), Fall 2012
